Here you can find a collection of things that may be helpful, including slide decks, a curated list of introductory papers and blog posts, as well as some infographics I have generated to explain various things.
Slides
- “Trust the process? (Causal) Mediation Analysis” (LMU 2025)
- “Thinking more clearly about correlation and causation with causal graphs” (BGU Seminar 2025)
- “Models as prediction machines: How to convert confusing coefficients with marginaleffects” (CLiMB Lab Meeting Dec 5)
- “Making rigorous causal inference more mainstream” (CIIG 2025)
- “A new approach to the age-period-cohort problem” (DPPD 2025)
- “Everything is causal inference (and causal inference is all the same)” (MPIB 2025)
Slides for more talks I have given can be found on the Open Science Framework in my Quick Files project here.
Introductory papers
I have written several papers to introduce researchers from psychology (and other fields) to causal inference. Here are some that may be useful if you are new to the topic:
- Thinking clearly about correlations and causation: Graphical causal models for observational data: This is my central primer to causal inference which provides a very non-technical introduction to directed acyclic graph, a great tool to reason about causality.
- That’s a lot to process! Pitfalls of popular path models: This paper discusses both mediation analysis and moderation analysis from a causal angle.
- These are not the effects you are looking for: Causality and the within-/between-persons distinction in longitudinal data analysis: If you are into longitudinal data analysis and are somewhat confused about how that connects to causal inference, this one may be for you.
- Causal inference for psychologists who think that causal inference is not for them: This includes a very compact but non-technical introduction to causal inference (potential outcomes framework and directed acyclic graphs), followed by a discussion of two topics that may be of particular relevance to social psychologists and personality psychologists: post-treatment bias (bias that threatens internal validity in randomized experiments) and incremental validity (something that personality psychologists enjoy talking about).
- The causal cookbook: Recipes for propensity scores, g-computation, and doubly robust standardization: This one focuses on different methods to estimate causal effects and provides a quite broad and non-technical overview; it may be helpful if you want to understand how the different approaches in the literature are related to each other.
- Thinking clearly about age, period, and cohort effects: An introduction to the age-period-cohort problem that gives an overview over the different “solutions” out there.
- The taboo against explicit causal inference in nonexperimental psychology: If you think that “just use more careful language” is a good way to deal with the causal inference problems that arise in observational data, this one is for you — we make the point that being weasely and vague about causality does very little to actually improve inferences and suggest an alternative approach.
Blog posts
The 100% CI is a blog that I run together with three friends of mine, Anne Scheel, Ruben Arslan, and Malte Elson. Here are a couple of posts that may be helpful:
- Writing about technical topics in an accessible manner: Some writing advice.
- Causal Inference | Hypothesis Testing | All at Once: Some researchers like to think that they are testing causal theories with the help of observational data, rather than doing causal inference. In this one I explain how these two approaches can be translated into each other with the help of the notion of test severity.
- ✨ Unleash your inner stats sparkle ✨ with this very non-technical introduction to marginal effects: Psychologists like to interpret models by looking at the coefficients. Marginal effects provide a handy alternative that has a lot of conceptual advantages; for example, you can stop worrying about how to code your categorical predictors.
- A casual but causal take on measurement invariance: If you have ever been confused about the idea of measurement invariance, this one is for you.
- Why you are not allowed to say that your 95% confidence interval contains the true parameter with a probability of 95%: This one is precisely about what the title says!
Infographics
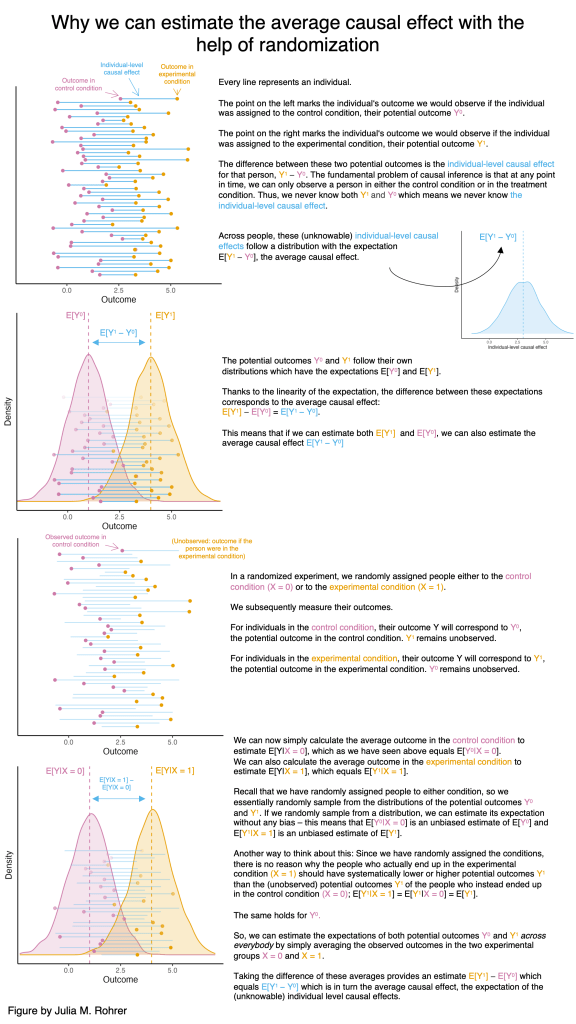
When I gave lectures or talks, I used to struggle with explaining how randomized experiments can actually work. I thus generated a small infographic (link to just the figure) that uses the potential outcomes notation and illustrates how in a randomized experiment the difference in the average outcome between the two groups identifies the average of the individual-level causal effects.
If you want to re-use or adapt this, you can download a ZIP file that contains all the materials here. This contains the underlying R-code, the individual panels, and the PowerPoint file in which I brought it all together.
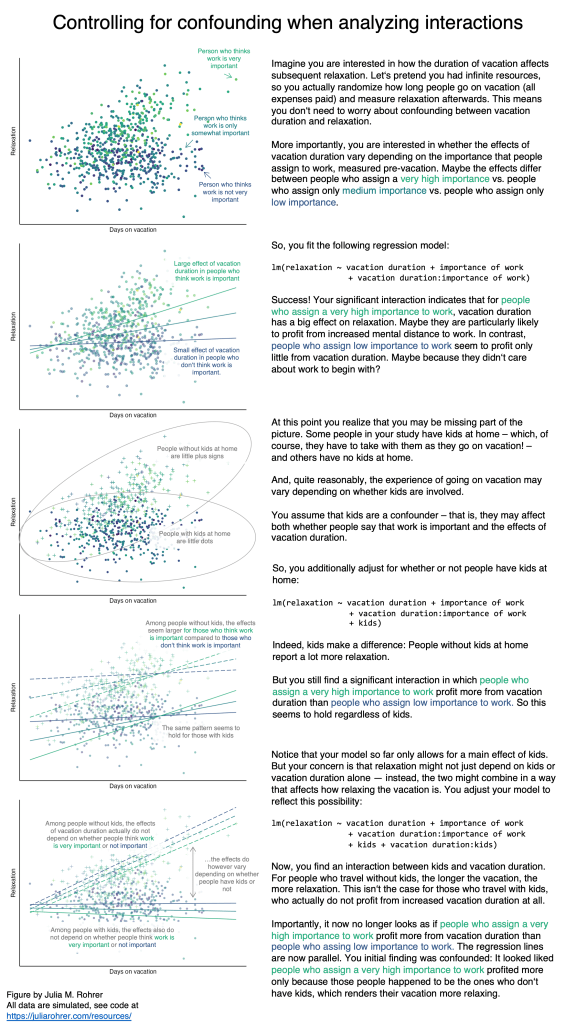
Another thing I occassionally have to explain is how estimates of interactions may be confounded – and how appropriate statistical control requires the confounder to be interacted with the treatment of interest. I made another illustration to drive home this point, here’s a link to just the figure.
Here’s the ZIP file containing containing the materials (R-code, individual panels, PowerPoint file to bring it all together): Figure Interactions.zip.
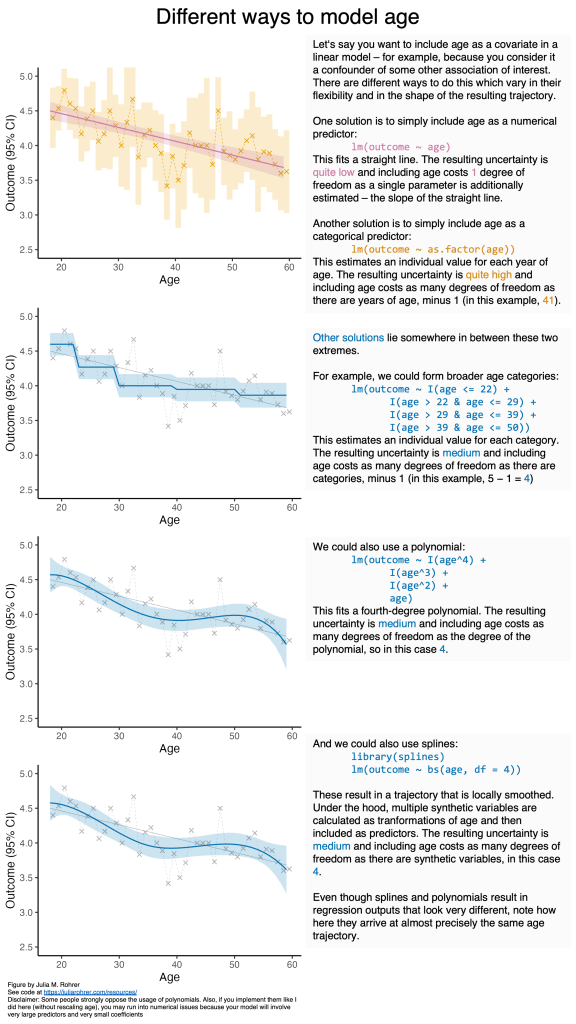
And here’s a figure illustrating different ways to include age (or other predictors) in a model with varying degrees of flexibility. Here’s a link to just the figure and you can download all materials necessary to reproduce it (R-code to generate individual panels, PowerPoint file bringing it all together) here.